

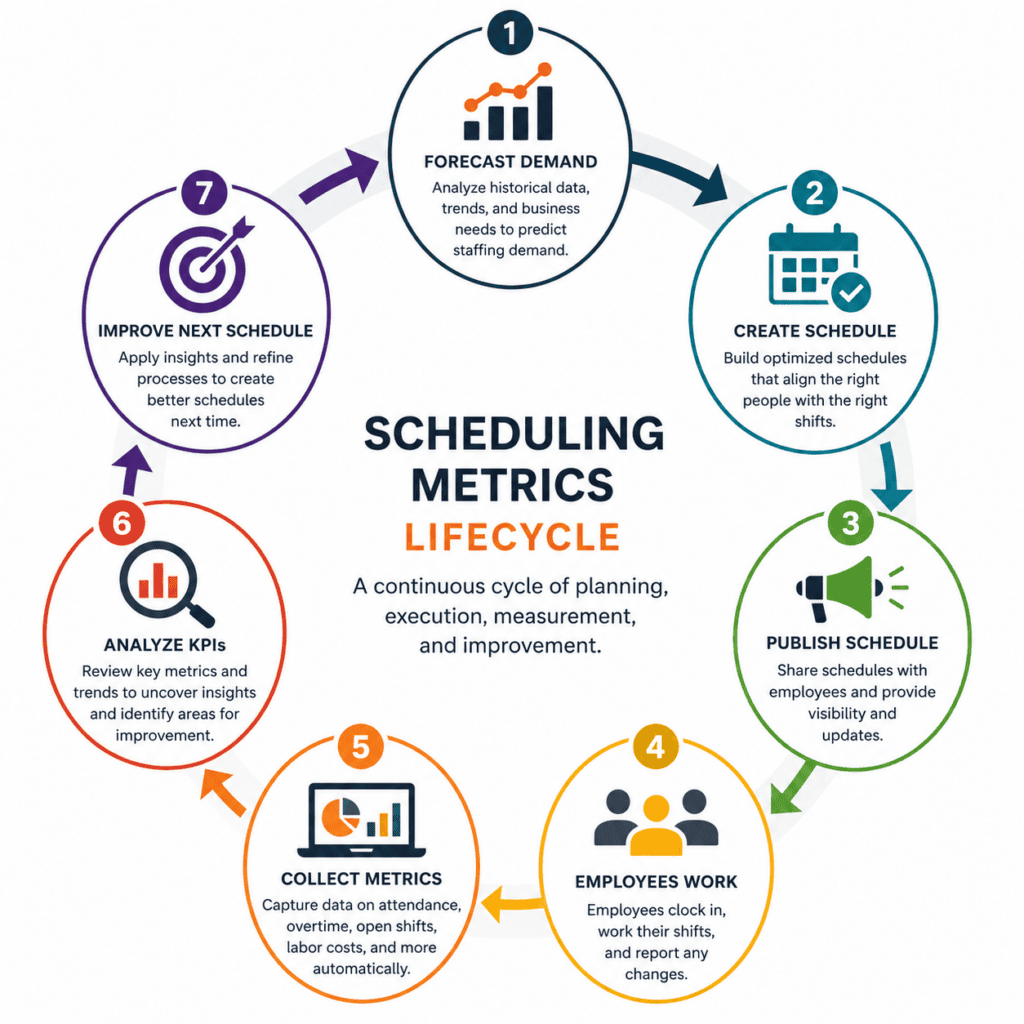
Employee scheduling doesn’t end when the schedule is published. The most successful organizations continuously measure how well their schedules perform and use that data to improve staffing decisions, reduce labor costs, and create a better experience for employees.
Whether you manage a security team, healthcare workforce, hotel staff, facilities team, manufacturing operation, or event personnel, tracking the right employee scheduling metrics helps answer important questions:
- Are we scheduling the right number of people?
- Are we controlling overtime?
- Are employees showing up as scheduled?
- How much time are managers spending creating schedules?
- Are employees satisfied with the scheduling process?
High-performing organizations don’t rely on a single metric to evaluate scheduling success. Instead, they monitor a combination of operational, financial, and employee-focused KPIs that provide a complete picture of workforce performance. Together, these metrics help managers identify trends, improve scheduling decisions, and continuously optimize operations.
Why Employee Scheduling Metrics Matter
Many organizations still rely on intuition when evaluating schedules. While experienced managers often have a good sense of what works, objective data provides a clearer picture of workforce performance.
Tracking employee scheduling KPIs helps organizations:
- Improve labor utilization
- Reduce overtime expenses
- Increase schedule accuracy
- Fill shifts faster
- Improve employee satisfaction
- Reduce absenteeism
- Identify staffing trends
- Make better scheduling decisions over time
Without these insights, scheduling becomes reactive instead of strategic.
Instead of simply asking:
- Did we publish the schedule?
Modern workforce managers ask:
- Did we fill every shift?
- Did we control overtime?
- Were employees assigned fairly?
- Did labor costs stay within budget?
- Did employees actually work as scheduled?
Answering these questions requires meaningful workforce analytics rather than intuition alone.
1. Schedule Fill Rate
What Is Schedule Fill Rate?
Schedule fill rate measures the percentage of required shifts that are successfully assigned to qualified employees.
Formula
Schedule Fill Rate = (Filled Shifts ÷ Total Required Shifts) × 100
A high fill rate indicates your organization is effectively covering operational needs. A low fill rate often signals staffing shortages, scheduling inefficiencies, or insufficient employee availability.
Why It Matters
Poor shift coverage can lead to:
- Reduced customer service
- Increased overtime
- Employee burnout
- Revenue loss
- Compliance risks
Organizations that consistently achieve high schedule fill rates are better positioned to maintain service quality while controlling labor costs.
Benchmark
Many organizations strive for a schedule fill rate above 95%, although the ideal target varies by industry, workforce size, and staffing model.
How to Improve It
- Forecast staffing demand accurately
- Maintain current employee availability
- Enable open shift notifications
- Allow qualified employees to claim available shifts
- Use AI-assisted scheduling to identify the best available staff
2. Overtime Hours
What Are Overtime Hours?
Overtime hours measure the amount of employee time worked beyond standard schedules or labor agreement thresholds.
While some overtime is unavoidable, consistently high overtime often indicates scheduling inefficiencies or inadequate staffing.
Why It Matters
Excessive overtime can:
- Increase labor costs
- Contribute to employee fatigue
- Increase turnover
- Reduce productivity
- Create compliance risks
Look Beyond Total Hours
Effective workforce managers monitor:
- Overtime by employee
- Overtime by department
- Overtime by location
- Overtime by customer
- Weekly and monthly overtime trends
These insights help identify recurring staffing shortages rather than isolated scheduling issues.
How to Improve It
- Forecast staffing needs accurately
- Balance workloads fairly
- Monitor overtime while building schedules
- Apply automated scheduling rules
- Fill open shifts before overtime becomes necessary
3. Open Shift Percentage
What Is Open Shift Percentage?
Open shift percentage measures the percentage of required shifts that remain unfilled.
Formula
Open Shift Percentage = (Open Shifts ÷ Total Required Shifts) × 100
Why It Matters
Open shifts can result in:
- Missed service commitments
- Increased overtime
- Last-minute scheduling
- Manager stress
- Lower customer satisfaction
Analyze Patterns
Instead of focusing on individual open shifts, look for trends.
For example:
- Certain locations consistently have staffing shortages.
- Weekends require additional coverage.
- Seasonal demand exceeds available employees.
Understanding these patterns helps organizations improve forecasting and hiring decisions.
How to Improve It
- Publish schedules earlier
- Allow employees to claim open shifts
- Enable shift swaps
- Send instant mobile notifications
- Keep employee availability current
4. No-Show Rate
What Is No-Show Rate?
No-show rate measures how often employees fail to report for scheduled shifts without prior notice.
Formula
No-Show Rate = (No-Show Shifts ÷ Scheduled Shifts) × 100
Why It Matters
High no-show rates affect:
- Customer service
- Team morale
- Labor costs
- Operational continuity
- Manager productivity
Look for Trends
Rather than viewing no-shows as isolated events, analyze:
- Frequent no-show employees
- Locations with higher absence rates
- Days of the week with increased absenteeism
- Seasonal attendance patterns
This information can uncover scheduling issues that aren’t immediately obvious.
How to Improve It
- Send automated reminders
- Require schedule acknowledgment
- Provide schedules through a mobile app
- Track attendance history
- Address recurring attendance issues early
5. Labor Cost as a Percentage of Revenue
What Is Labor Cost Percentage?
This KPI compares labor expenses with organizational revenue.
Formula
Labor Cost % = (Total Labor Cost ÷ Revenue) × 100
Since labor is often an organization’s largest operating expense, even small improvements can significantly affect profitability.
Why It Matters
Monitoring labor costs helps organizations:
- Optimize staffing
- Improve profitability
- Identify overstaffing
- Compare performance across locations
- Improve workforce planning
Look Beyond Labor Costs
Labor cost should never be evaluated in isolation.
For example:
- Cutting staffing may reduce labor costs but hurt customer service.
- Increasing overtime may improve coverage while reducing profitability.
- Overstaffing may improve service but negatively impact margins.
The best workforce managers evaluate labor costs alongside scheduling, attendance, and operational performance to achieve the right balance.
6. Schedule Creation Time
What Is Schedule Creation Time?
Schedule creation time measures how long managers spend building and publishing employee schedules.
Many organizations still spend hours—or even days—creating schedules manually.
Why It Matters
Long scheduling cycles:
- Reduce manager productivity
- Delay schedule publication
- Increase errors
- Create additional revisions
Measure More Than Initial Creation
Managers should also monitor:
- Time spent making revisions
- Number of schedule versions published
- Time required to fill last-minute vacancies
Reducing administrative work allows managers to spend more time supporting employees and operations.
How to Improve It
- Use schedule templates
- Automate recurring schedules
- Apply scheduling rules automatically
- Replace spreadsheets with scheduling software
- Use AI-assisted schedule optimization
Organizations using automated scheduling software often report reducing schedule creation time by up to 95%, freeing managers to focus on higher-value work.
7. Employee Satisfaction with Scheduling
Employee satisfaction is one of the most overlooked scheduling metrics, yet it has a significant impact on retention, engagement, and productivity.
Employees value:
- Predictable schedules
- Fair distribution of shifts
- Advance notice
- Flexible availability updates
- Easy shift swaps
Signs of Healthy Scheduling
Indicators of employee satisfaction include:
- High schedule acceptance rates
- Fewer shift swap requests
- Lower turnover
- Better attendance
- Positive employee feedback
Organizations that consistently improve scheduling fairness often see improvements across multiple workforce metrics.
Build a Workforce Scheduling Dashboard
No single KPI tells the whole story.
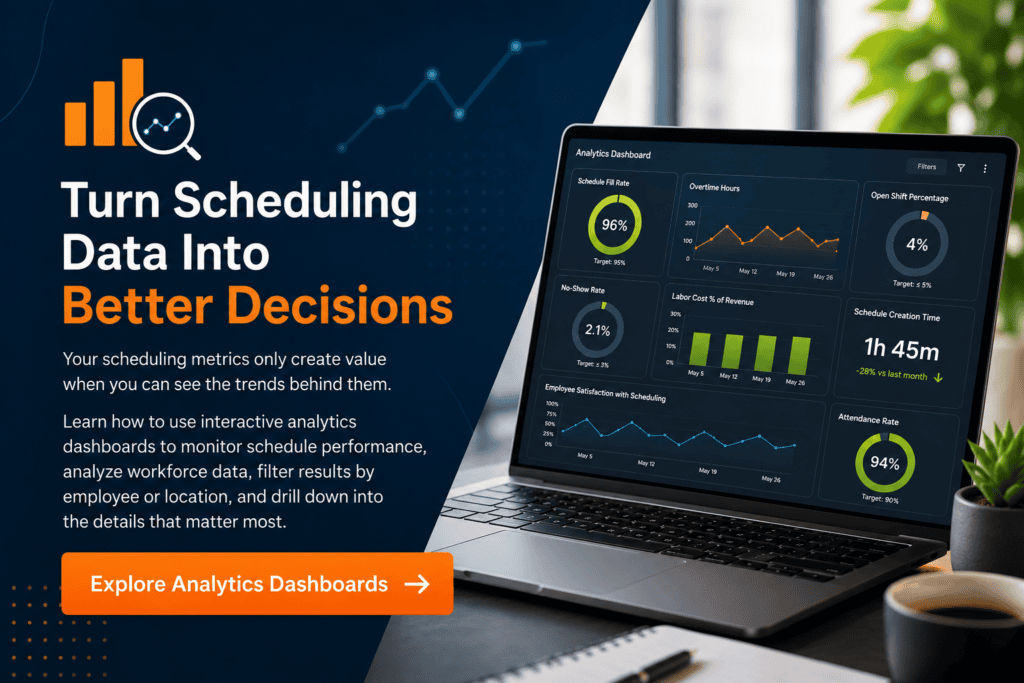
The most effective organizations monitor scheduling performance with dashboards that consolidate operational, financial, and workforce metrics in a single view. Viewing these metrics together provides a much more complete understanding of workforce performance than any individual KPI.
| Category | Metrics |
| Scheduling | Schedule fill rate, open shift percentage, schedule creation time |
| Attendance | No-show rate, attendance percentage, late arrivals |
| Labor Costs | Overtime hours, labor cost as a percentage of revenue |
| Productivity | Hours worked, staffing utilization, coverage by location |
| Workforce Experience | Schedule acceptance, shift swaps, employee satisfaction |
Look for Trends, Not Just Reports
Individual reports provide snapshots of performance, but trend analysis reveals opportunities for improvement.
Reviewing scheduling metrics over weeks and months helps answer questions such as:
- Is overtime increasing?
- Are open shifts becoming more common?
- Which locations consistently experience staffing shortages?
- Are attendance rates improving?
- Is scheduling becoming more efficient over time?
Monitoring trends enables managers to make proactive decisions before small problems become operational challenges.
Weekly Scheduling KPI Checklist
Before publishing your next schedule, review these questions:
✔ Are all critical shifts filled?
✔ Are overtime hours within target?
✔ Has the number of open shifts decreased?
✔ Are attendance and no-show trends improving?
✔ Are labor costs aligned with business goals?
✔ Was the schedule created efficiently?
✔ Are employees satisfied with the scheduling process?
Consistently reviewing these KPIs transforms scheduling from a weekly administrative task into a continuous process of operational improvement.
How Employee Scheduling Software Improves Every KPI
Modern employee scheduling software provides far more than digital scheduling.
Today’s workforce management platforms help organizations monitor:
- Schedule fill rates
- Open shifts
- Employee availability
- Attendance trends
- Overtime usage
- Labor costs
- Staffing by location
- Payroll validation
- Billing accuracy
- Workforce utilization
- Schedule revisions over time
Instead of collecting information from spreadsheets and multiple systems, managers gain a centralized view of workforce performance that supports faster, data-driven decision-making.
Gain Insights for Continual Improvement
The most effective organizations don’t simply create schedules; they continuously improve them.
By tracking schedule fill rate, overtime hours, open shift percentage, no-show rate, labor costs, schedule creation time, and employee satisfaction, workforce managers gain the insights needed to reduce costs, improve operational efficiency, and deliver better service.
When combined with modern workforce management software and meaningful analytics, these metrics transform scheduling from a reactive administrative task into a strategic advantage for employees, managers, customers, and the organization as a whole.
Frequently Asked Questions
What are employee scheduling metrics?
Employee scheduling metrics are key performance indicators (KPIs) used to measure the effectiveness, efficiency, and cost of employee scheduling processes.
What is the most important employee scheduling KPI?
There isn’t a single most important KPI. Organizations should monitor schedule fill rate, overtime hours, open shifts, no-show rates, labor costs, scheduling efficiency, and employee satisfaction together to understand overall scheduling performance.
What is a good schedule fill rate?
Most organizations aim for a schedule fill rate above 95%, although targets vary by industry and staffing requirements.
How often should scheduling metrics be reviewed?
Operational KPIs should typically be reviewed weekly, while monthly and quarterly trend analysis helps identify longer-term opportunities for improvement.
What is a workforce scheduling dashboard?
A workforce scheduling dashboard provides a centralized view of key scheduling metrics—including shift coverage, attendance, overtime, labor costs, and scheduling efficiency—to help managers monitor workforce performance and make informed staffing decisions.
How does scheduling software improve workforce performance?
Scheduling software automates scheduling, applies business rules, tracks attendance, improves communication, and provides workforce analytics that help managers continuously improve scheduling performance.